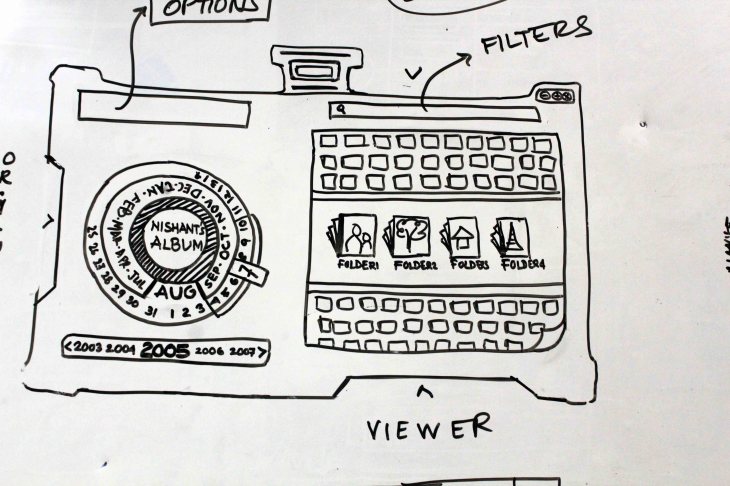
This is an ideation sketch drafted before actually designing the paper prototype.

This is an ideation sketch drafted before actually designing the paper prototype.
This picture shows the concept of space filters which I intended to use in the application.
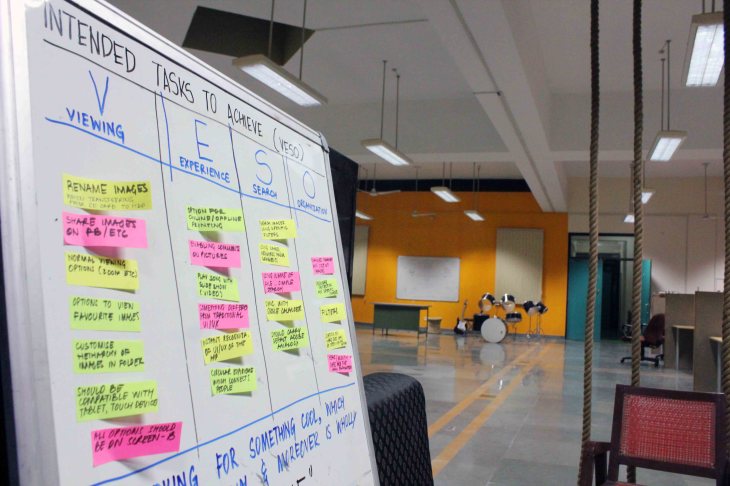
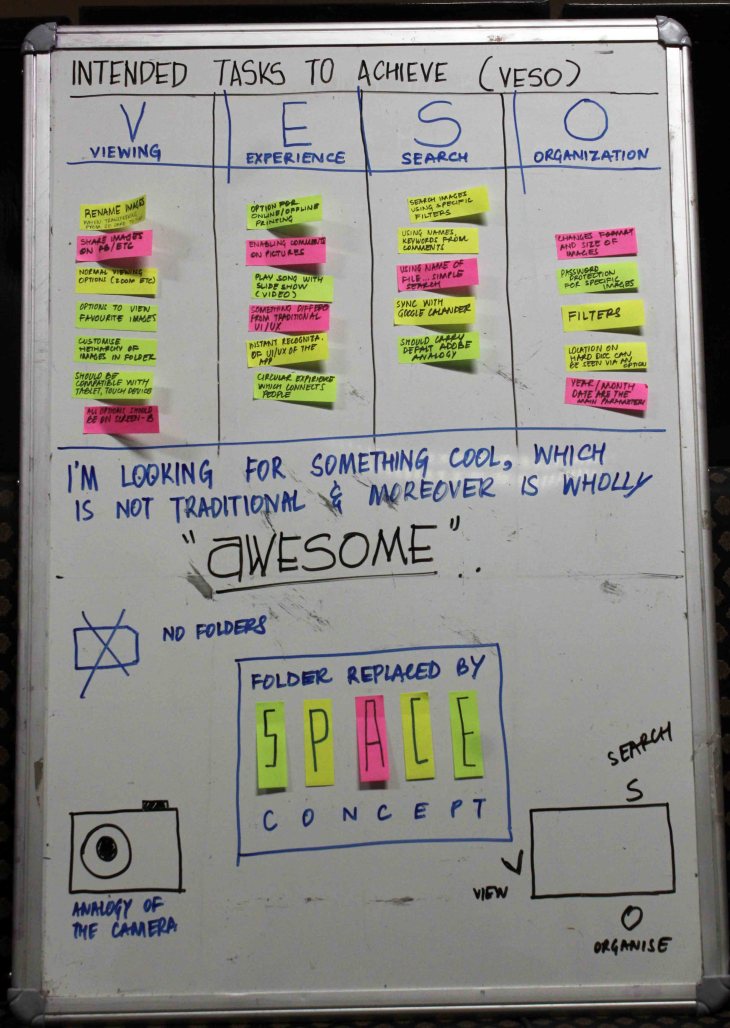
A Click from our brainstorming session Here the tasks were identified which I wanted to be on VESO.
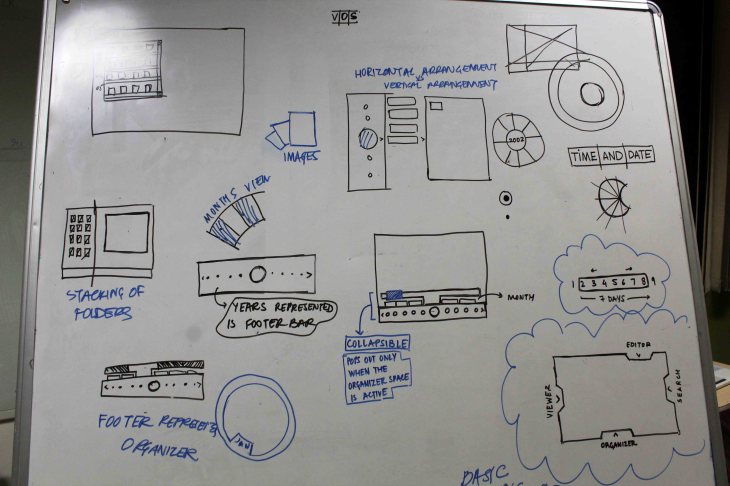
The following was a rapid brainstorming and sketching session to get the ideas for the experience design of UI. I also derived some concepts after creating a zoning diagram on basis of the 80/20 Rule, Hick’s Law, Gutenberg’s Diagram, Iconic Representation and Performance Load rule.
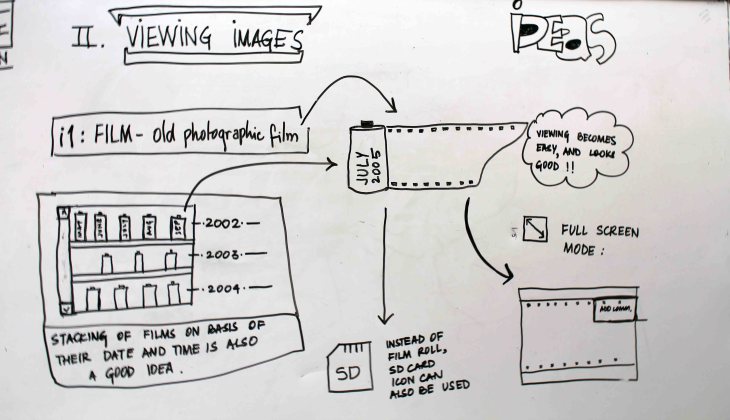
Following the Analogy of the Old Silver Nitrate Photographic Film
As per the plan, following targets were achieved today:
1. REVIEW STUDY– Review of the existing similar software available in the market.
2. QUESTIONNAIRE – Another questionnaire regarding the project was circulated and the results were demonstrated in form of pie charts.
3. WIREFRAME – Based on the requirements framed from the analysis of case studies, a rough wireframe was drafted keeping in mind the tasks.
4. PAPER PROTOTYPE – A low fidelity paper prototype was designed, which would be tested in the next stage for the review from the test Users.
5. LITERATURE STUDY – Took reference from the book named “UNIVERSAL PRINCIPLES OF DESIGN”, by William Lidwell and Kritina Holden. 5 theories of Design were studies namely –
a. The 80/20 Rule – A high percentage of effects in any large system are caused by a low percentage of variables.
b. The Hick’s Law – The time it takes to make a decision increases as the number of alternatives increases
c. Gutenberg Diagram – A diagram that describes the general pattern followed by the eyes when looking at evenly distributed, homogeneous information.
d. Iconic Representation – The use of pictorial images to improve the recognition and recall signs and controls.
e. Performance Load – The greater the effort to accomplish a task, the less likely the task will be accomplished successfully.
The plan was to implement these principles while designing the wire frame and placing the buttons and options on the UI paper prototype.


Following is the detail of tasks achieved during this chunk of time:
A. USER RESEARCH – A questionnaire of 5 questions was distributed among 36 people and the results were analyses. The analysis of these results helped me to identify the needs of the end user. A diagram was built, which suggested that what are the parameters that are to be worked out on in order to design the software.
B. FRAMING THE OBJECTIVES – It is important to know that what is to be achieved and how. So a list of tasks was framed which listed the objectives of the project.
C. IDEATION – An ideation was done in order to get ideas to achieve the objectives. These will be summarized in the next post.
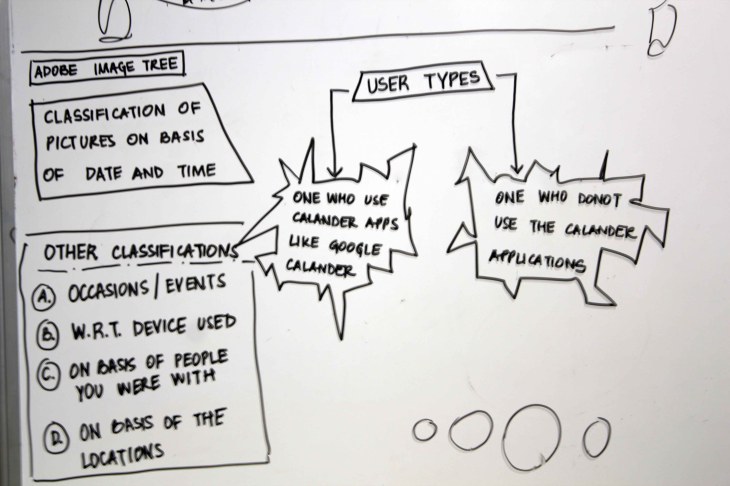
There were number of classifications in which the pictures on the PC can be managed such as:
Occasions/Events, Classification w.r.t. the device used to click the pictures, Classification on basis of people the User was with, On basis of the location of the pictures.
But as stated in the problem statement, the software has to work solely on DATE & TIME information available in the Digital Photographs, hence the idea of classification on basis of the above factors is negated.
Moreover, keeping in mind the need statement, two categories of Users are identified:
1. The one who use the Calender Applications like Google Calendar, etc
2. Those who don’t use the Calender Applications like Google Calender, etc.